Trend analysis
Alerts can be triggered based on live value, but also on trend analysis. In a trend analysis, the historical data of a tag is analyzed cyclically.
Trend interval
First of all, it is necessary to set the interval at which the analysis will be performed. This also defines the size of the sample to be evaluated:
- ¼ hour: Every 15 minutes the values of the past 24 hours are analyzed
- Hour: Every 60 minutes the values of the past 96 hours (4 days) are analyzed
- Day: Every 24 hours the values of the past 96 days (approx. 3 months) are analyzed
- Week: Every 7 days the values of the past 96 weeks (approx. 2 years) are analyzed
- Month: Every month the values of the past 96 months (approx. 8 years) are analyzed
Mean value analysis
A mean value over the entire period (in the example: 3.05), as well as the deviation of the last period (in the example: 0.45) is determined. The alert is triggered when the value exceeds, falls below or deviates from the trigger value, which can be specified as a relative or absolute value.
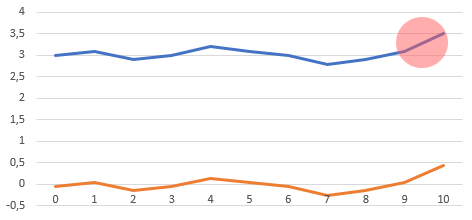
Example: Alerting at mean value deviation > 0.2 or 10%.
Slope analysis
The slope over the entire period (in the example: 0.54), as well as the slope of the last period (in the example: 1.6) is determined. The alert is triggered when the value exceeds, falls below or deviates from the trigger value, which can be specified as a relative or absolute value.
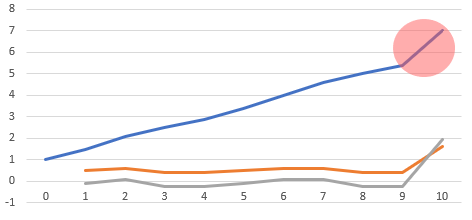
Example: Alerting at slope > 1 or 100%.