Data table
A data table structures several tags into complete data sets. The first tag in the definition of a data table acts as a unique identifier (ID) for a data set. If the value of this identifying tag changes, the current data record is closed and a new one is started.
Structure of a data table:
- Start: Timestamp at which the data record was created
- End: Timestamp at which the data record was completed
- 1. tag: Serves as an ID for identifying and creating a new data record
- Further tags: Any additional information that is assigned to the data record
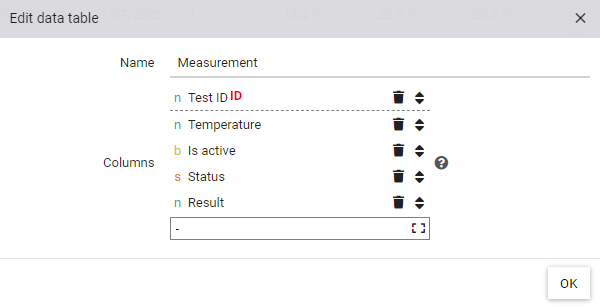
Create data table
In tree, a new data table can be created in the Global values node via the icon. The data table can be extended with additional columns as needed by dragging and dropping tags from the object tree into the designated field.
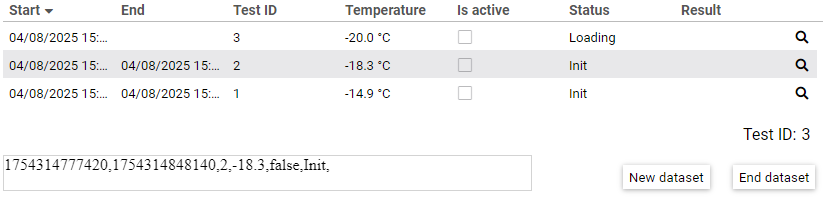
Data records
Each time the value of the ID tag changes, the current record is automatically closed and a new one is started. Special case: If the value of the ID tag changes to 0, the current record is closed, but no new one is created. For visualization purposes, the data table can be inserted into a view via drag-and-drop. By clicking the magnifying glass , a recorded data record can be analyzed in detail. All tags recorded independently of the data table are additionally displayed in a chart within the time range of the selected record.
Programmatic interaction
The Vizual Web content allows interaction with a data table. To enable this, the desired data table must be dragged into the programming interface of the code editor. Once inserted, the rows of the table become selectable, and the current selection can be analyzed and further processed within the Vizual Web Content.
JavaScript in the code editor
    anyviz.dataTables.Measurement.onSelectionChange(function(selection) {
    console.log(selection);
    });