Heatmap
The heatmap is a diagram for visualization, which shows the magnitude of the individual values within a dataset as a color. The representation is in boxes, as a carpet or in the form of a grid.
2 color scale
By default, the Heatmap vizual has a start color to represent the smallest value and an end color to represent the largest value. The resulting color scale defines the color coding of the remaining values.
3 color scale
Optionally, a color can be defined for the mean value. This results in a color scale between the smallest value and the mean value and another color scale between the mean value and the largest value.
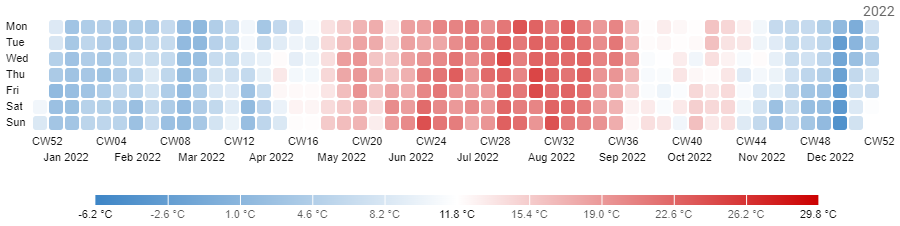
Single tag mode
If only one tag is assigned to the heatmap vizual, the distribution in Y-direction is done according to the following date property:
- One day or less: distribution in ¼-hours
- One month or less: distribution in hours
- One year: distribution in weekdays
Multi tag mode
If multiple tags are assigned to the heatmap vizual, each tag is assigned a row. This allows you to quickly compare the value progression of multiple tags.