Vizuals
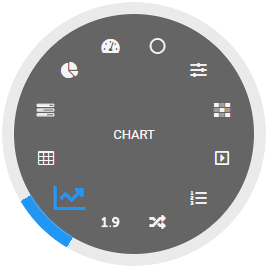
Vizuals can be created by dragging and dropping tags or alerts into the view. Usually there are several vizuals to choose from for one tag type (see picture). On some vizuals multiple tags can be droped.
After adding vizuals to the view, they can be arranged and configured using the view editor.
Vizuals cannot be operated when editing mode is active. Also, configured dynamizations are only active after leaving the editing mode. Some functions of Vizuals, such as writing tag values, depend on the user role or whether the tag is writable or readonly.
| Supported tag types | |||||
|---|---|---|---|---|---|
| Vizual | Num | Bool | String | Brief description | |
| Tag display | Display of a tag value incl. input option | ||||
| Chart | Line or bar chart of the recorded time-value pairs | ||||
| Pivot | Visualization of aggregated data in a table | ||||
| Progress | Progress display as bar graph with specification of min and max | ||||
| Pie chart | Plot of multiple tag values as a pie | ||||
| Gauge | Tacho display of a tag value | ||||
| Wheel | Circle shape for value input | ||||
| Slider | Tag value input via slider | ||||
| Heatmap | Visualizes recorded data with color gradation | ||||
| Button / Dropdown | Tag value input as button group or dropdown list | ||||
| Test list | Text display depending on numeric tag value | ||||
| Sankey | For the hierarchical visualization of volume flows | ||||
| Toggle | Tag value input for logical values | ||||
| LED | Shortcut for an icon vizual with color switching (green when true). | ||||
| Map | * | Display of recorded position data on the map | |||
| Manual input | For entering values that are not automatically captured (only for global tags). | ||||
Vizuals for remote access
If tags for remote access have been configured in the Cloud Adapter, additional vizuals are available that are automatically created as soon as the remote access tags are dragged into the view.
| Vizual | Brief description | |
|---|---|---|
| Visu / HTTP Access | Access to a local webvisu or any web application | |
| VNC display | VNC Client to control remote PCs or panels | |
| Camera access | Display and control of a camera |
Controls
Besides the vizuals that can be created by dropping tags into views, there are also vizuals with a more static control character. These can be found in the tree.
| Vizual | Brief description | |
|---|---|---|
| Text | Static text for labels | |
| Button | Button for click functions | |
| Info field | Display of different object properties (e.g. name of a tag) | |
| Web content | Display of a URL or custom implement widget with data interface | |
| Alert Log | Tabular listing of current and historical alerts | |
| Task list | Tabular listing of due and upcoming tasks Only with Task management Add-On enabled | |
| Map | Map to display devices with position information | |
| Notification groups | For scheduled notification of user groups | |
| Shapes | Draw shapes: Rectangle, Rounded Rectangle, Circle and Line | |
| Logbook | For protocolling of important events | |
| Icon | Library with several thousands of icons in different styles | |
| Image | Use of any images | |
| Document | Display PDF files | |
| Charging management | For e-car charging stations (OCPP) with tag management and charging protocol Only with Charging Management Add-On enabled | |
| Operations diary | Automatic and manual collection of data for wastewater treatment plants and RÜB Only with Operations Diary Add-On enabled. |
Configuration
The vizuals offer many configuration options and can be dynamized or have a click function. More complex vizuals are described in a separate article.